Annual Inventory of U.S. Greenhouse Gas Emissions and Sinks
Each April, the U.S. Environmental Protection Agency releases an inventory of greenhouse gas emissions and sinks across all facets of economic activity and land use within the United States. This year’s inventory updates the data for 2021, and includes a historical look back at trends in emissions and sinks since 1990. These data are gathered, compiled, and reported annually to meet existing reporting requirements under the United Nations Framework Convention on Climate Change.
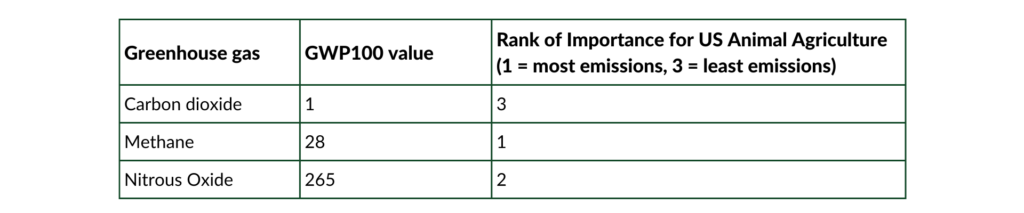
The three major greenhouse gases are carbon dioxide (CO2), methane (CH4), and nitrous oxide (N2O). Each one of these gases has a different potential to trap heat and atmospheric lifetime, which makes comparing across gases difficult. The comparison strategy or metric used by the EPA in its annual inventory is the 100 year global warming potential value, which compares gases to CO2’s warming potential over a 100 year time frame. In the latest inventory, the EPA uses the GWP100 values of 1 for CO2, 28 for CH4, and 265 for N2O (Table 1). Practically, this means 1 pound of methane is equivalent to 28 pounds of CO2 (CO2e where the e stands for “equivalence”) over a 100 year period. Methane is relatively short-lived in the atmosphere, and this combined with its higher potential to trap heat in the atmosphere, make methane emissions mitigation an attractive near-term climate solution.
Table 1. The main greenhouse gas emissions, their 100 year global warming potential (GWP100) used in the latest US EPA Greenhouse Gases and Sinks Inventory, and their relative contribution to US animal agriculture’s greenhouse gas emissions.
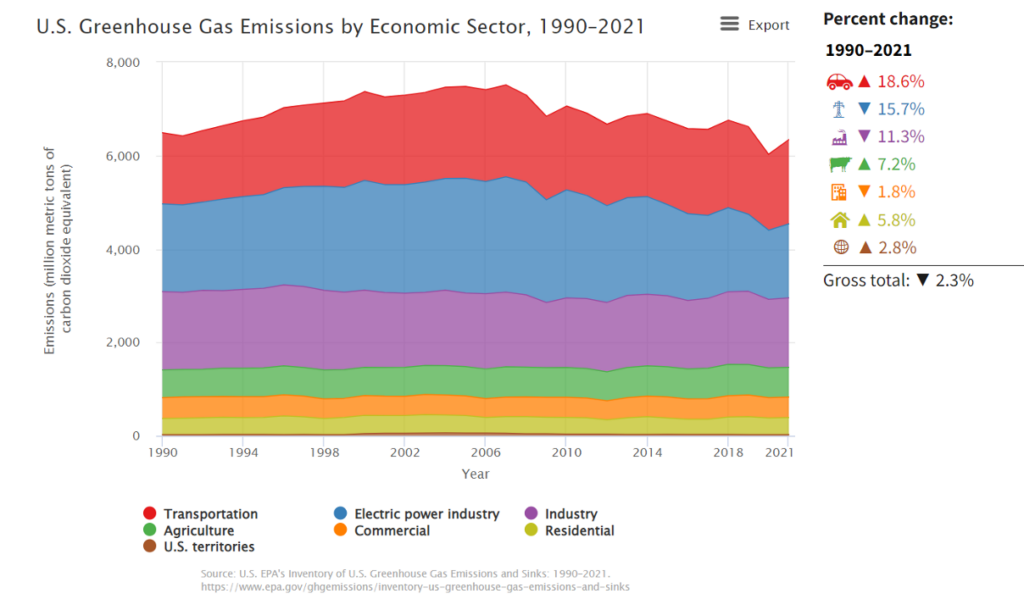
Greenhouse gas emissions in total have declined in the US since the mid-2000’s (Figure 1), which has primarily occurred via decreasing CO2 emissions from energy production as the US has shifted away from coal towards more natural gas and renewables, such as wind and solar.
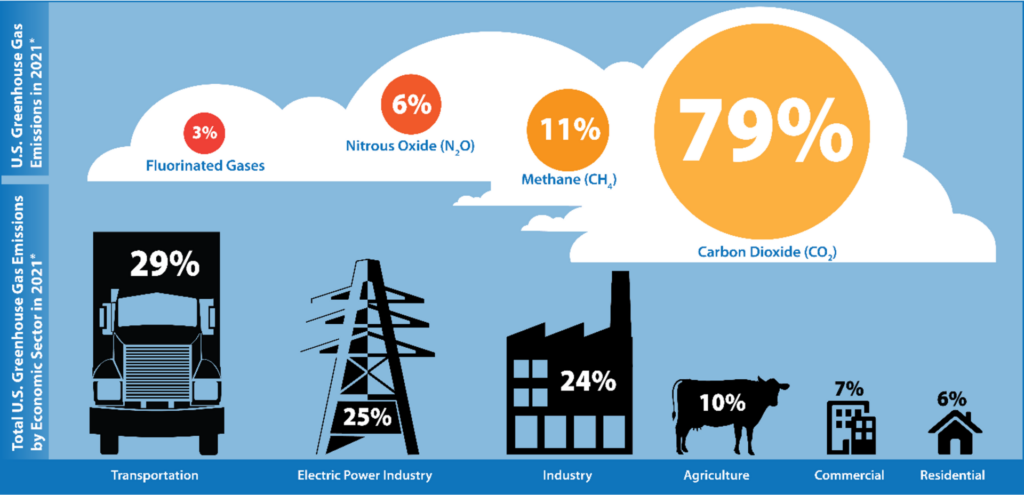
Carbon dioxide is the most important greenhouse gas and most greenhouse gases in the US come from fossil fuel combustion in the transportation, electric power, and industrial sectors (Figure 2).
Figure 1. Trends in US greenhouse gas emissions from 1990 to 2021 by industry sector.
Figure 2. 2021 US GHG emissions broken out by greenhouse gas and by economic sector.
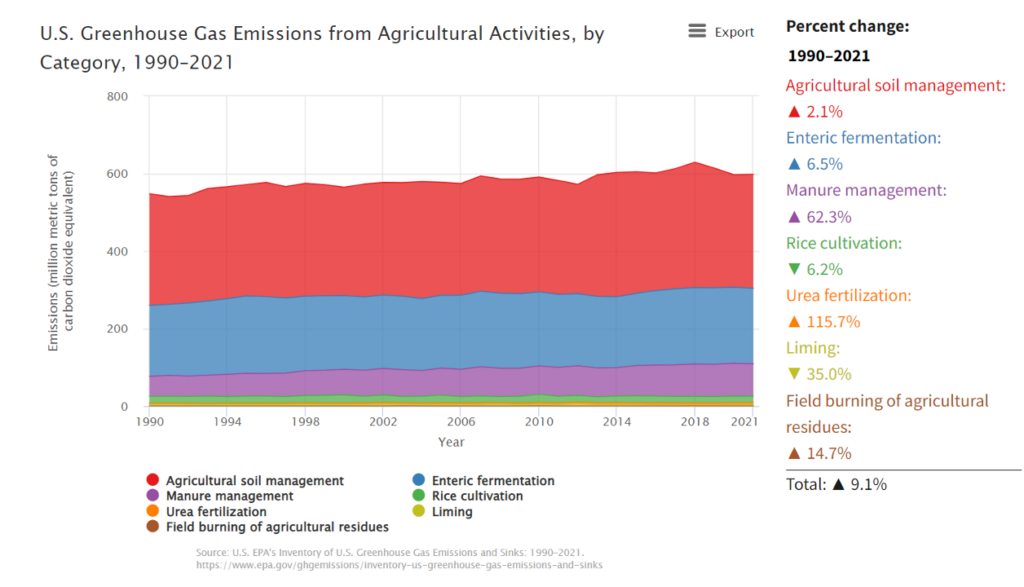
Total agricultural emissions in the US are slightly higher today than in 1990 (Figure 3).
Figure 3. Trends in US agriculture GHG emissions by source from 1990 to 2021.
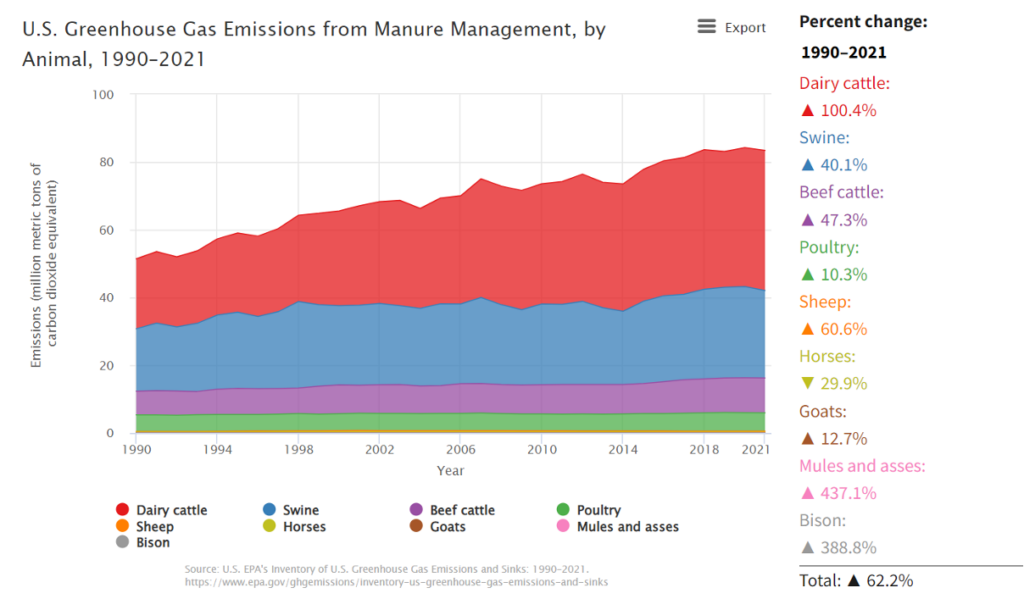
The increase has primarily been driven by increased methane emissions from animal manure management, particularly methane emissions from swine and dairy cattle manure. As both of those industries in the US have consolidated and responded to regulations that require manure storage to protect water quality, there has been an increase in anaerobic (oxygen free or not exposed to the air) manure lagoons. Anaerobic conditions are required for methane-producing microorganisms, hence the increase in methane emissions from swine and dairy operations, and the relatively minor methane emissions from beef feedlots and poultry operations, where manure is typically handled dry and exposed to the air (Figure 4). Manure management techniques such as anaerobic digestion andvermifiltration are promising technologies that can lower methane emissions from animal manure.
Figure 4. Trends in US greenhouse gas emissions from manure by animal type. Swine and dairy methane emissions have led to most of the increase in the category’s greenhouse gas emissions.
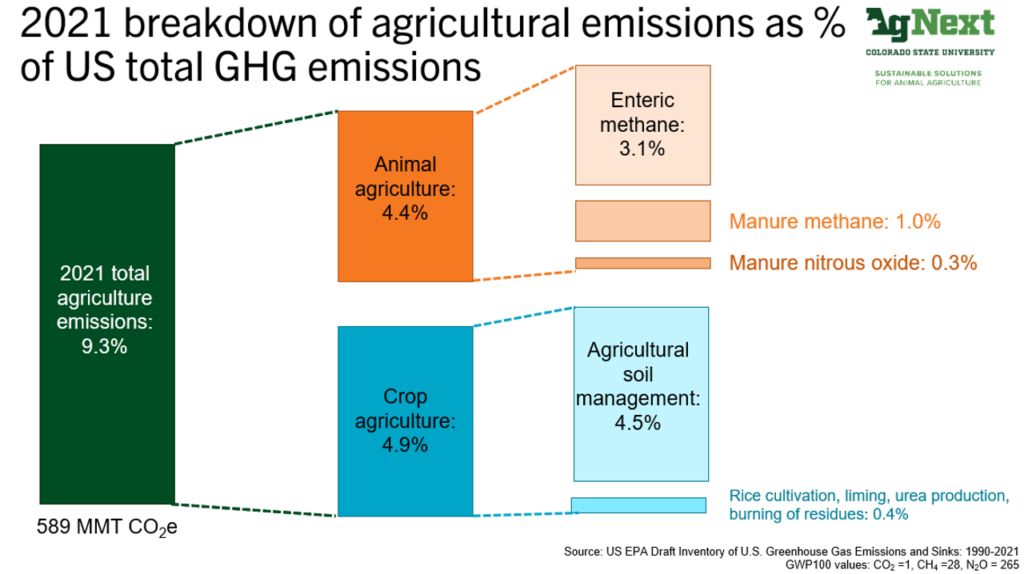
Enteric methane emissions are the largest source of greenhouse gas emissions that directly come from animal agriculture in the US (Figure 5). These emissions primarily occur from ruminant animals, such as cattle, sheep, and goats. Methane is a natural byproduct of rumen fermentation and is influenced by diet type and level of feed consumption, among other factors.In particular, as ruminant animals consume a higher forage diet, they tend to produce more methane emissions than those animals eating a higher concentrate (e.g., grain) diet. Additionally, animals that consume more feed tend to produce more methane emissions.
Figure 5. Greenhouse gas emissions from US agriculture in 2021 expressed as a percentage of total US emissions from the US EPA Greenhouse Gas Inventory of Emissions and Sinks. Emissions are categorized by their direct source, meaning emissions related to producing feed for livestock are included in the “crop agriculture” designation.
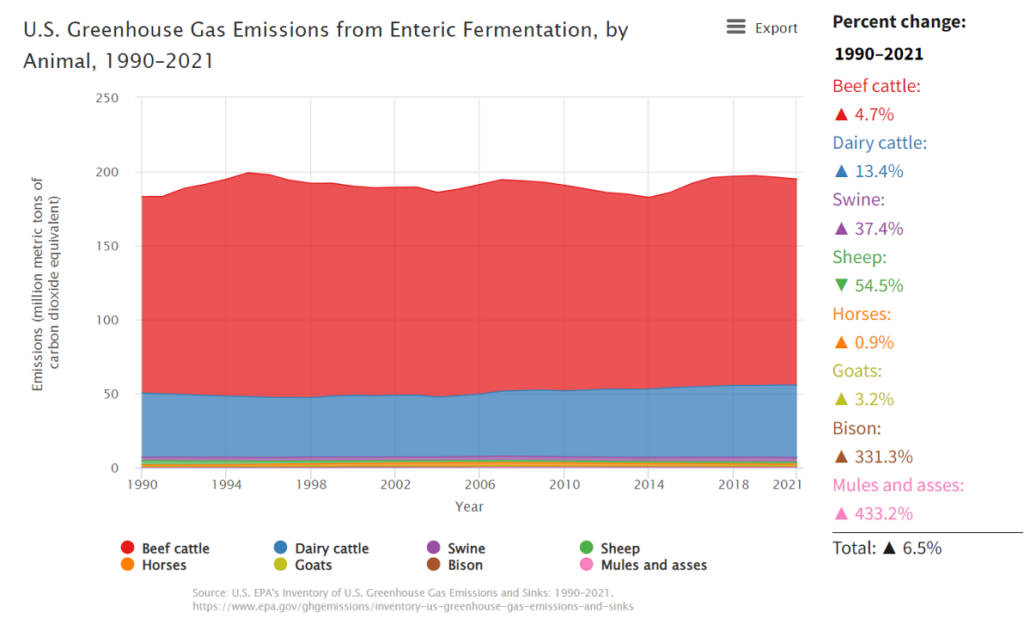
In the United States, methane emissions per beef and dairy animal have increased over time as cattle have become more productive, producing more milk, growing faster, and having a larger body size over time (Figure 6). All of these factors lead cattle to eat more, thus more methane has been produced per animal.
Figure 6. Trends in US enteric methane emissions by animal type from 1990 to 2021.
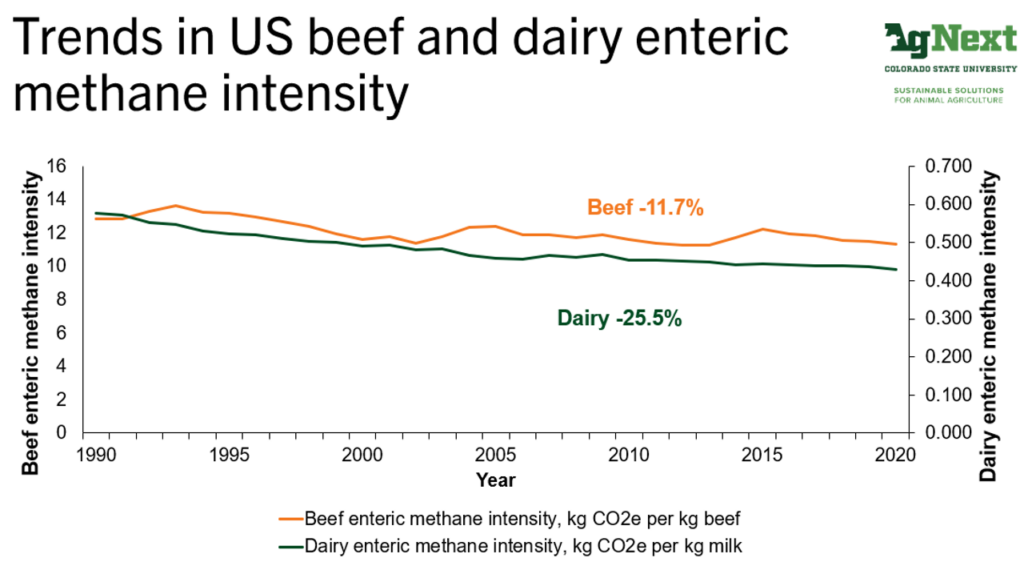
However, enteric methane emissions per lb. of beef and milk in the US have declined over time as productivity has increased faster than emissions (Figure 7). This decoupling of emissions growth from production is beneficial for meeting growing demand while lowering climate impact. However, an accelerated rate of decoupling is required to lower total emissions from US cattle production and achieve Net Zero.
Figure 7. Trends in US beef and dairy enteric methane emission intensity (kg of CO2e per kg of product) from 1990 to 2020.
At AgNext, we are working on collecting enteric methane emissions across a variety of cattle types, climates, management systems, and dietary interventions. While these experiments are useful in finding mitigation solutions that are effective, practical, scalable, and economically-beneficial, they also provide needed data to further refine enteric methane emissions prediction equations such as those used by the US EPA. In this way, AgNext research can help refine current baseline emissions inventories, providing a more accurate picture of the climate contributions of US cattle production and the mitigation potential.